 Statistics/Graphic
Statistics/Graphic
Statistics/GraphicClicking the Statistics button in Recorder activates the Statistics view. This displays the current workload situation in the Dictation Directory. If no dictation folders are selected, an empty graph will be shown.
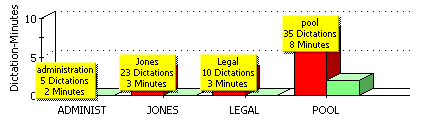
Each dictation folder will be represented by one red and one green bar; red for the number of unfinished dictation minutes, green for the number of minutes of dictations completed today. A left-click on a bar shows the contents of the relevant folder in Dictation Overview. Dictations can be dragged and dropped onto a bar to move them into that folder.
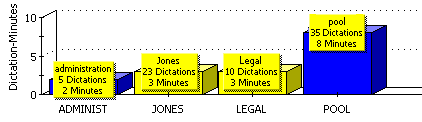
Clicking the Graphic button in Player activates a limited statistics view. Only the "unfinished" folders are displayed, i.e. work to be done. The bar is shown in blue when the folder is already in use (a dictation there is currently loaded by a colleague) or in yellow when no-one is actively loading dictations in that folder. You can use this to decide in which folder to load and type-up the incoming dictations.
 Consider using the
dictation folder monitoring function to receive
notification of new dictations arriving in multiple folders.
Consider using the
dictation folder monitoring function to receive
notification of new dictations arriving in multiple folders.
If you require the Player view
to be the same as the Recorder Statistics view
then change the
Statistics option on the Advanced tab to "Workload".
This display
can be completely disabled on the
Advanced tab if
the workload information should not be viewed by employees.
You can customize all the information shown in these views as
follows:
Right-click on the Statistics graph and select folders to be displayed with via the menu option "Dictation Folder in Statistics / [name of folder]".
 Alternatively, right-click on a folder name in the Dictation
Directory and select the menu option "Dictation
Folder / Show in the statistics".
Alternatively, right-click on a folder name in the Dictation
Directory and select the menu option "Dictation
Folder / Show in the statistics".
Right-click on the Statistics graph and remove folders to be displayed by clicking on the folder name in the menu "Dictation Folder in Statistics / [name of folder]".
A check symbol next to the folder name indicates that the folder will be displayed
in the Statistics view.
Changing
the Statistics display
Right-click on the Statistics
graph and select the menu option "Change
Display", followed by one of the following options:
 Folder short name
Folder name
Folder short name and
dictation time
Folder name
and dictation time
Without Labels
The Statistics graph will be automatically refreshed.
Please note that the Folder short name is
the first 8 letters of the name and NOT anything to do with Author/Typist
User initials.
Right-click on the Statistics graph and select the menu option "Print Statistics". This will print the graph on the default printer.
Drag & Drop Dictations into different folders
To move a dictation into a particular folder, left click on a bar to display the contents of a folder. Select one or multiple dictations in the Dictation Overview. Left-click on one of the selected dictations and hold the mouse key down, then drag and drop the selected dictations into one of the other bars (red for unfinished) on the graph. This will move the dictations into the folder represented by that bar.
The Statistics graph will be automatically refreshed.
Take care not to accidentally drop dictations onto the completed (green) bar if
they are still unfinished!